Profile Reflectometer
ne profiles and plasma position: multi-band swept-frequency measurement, physics-informed real-time reconstruction.

What it is
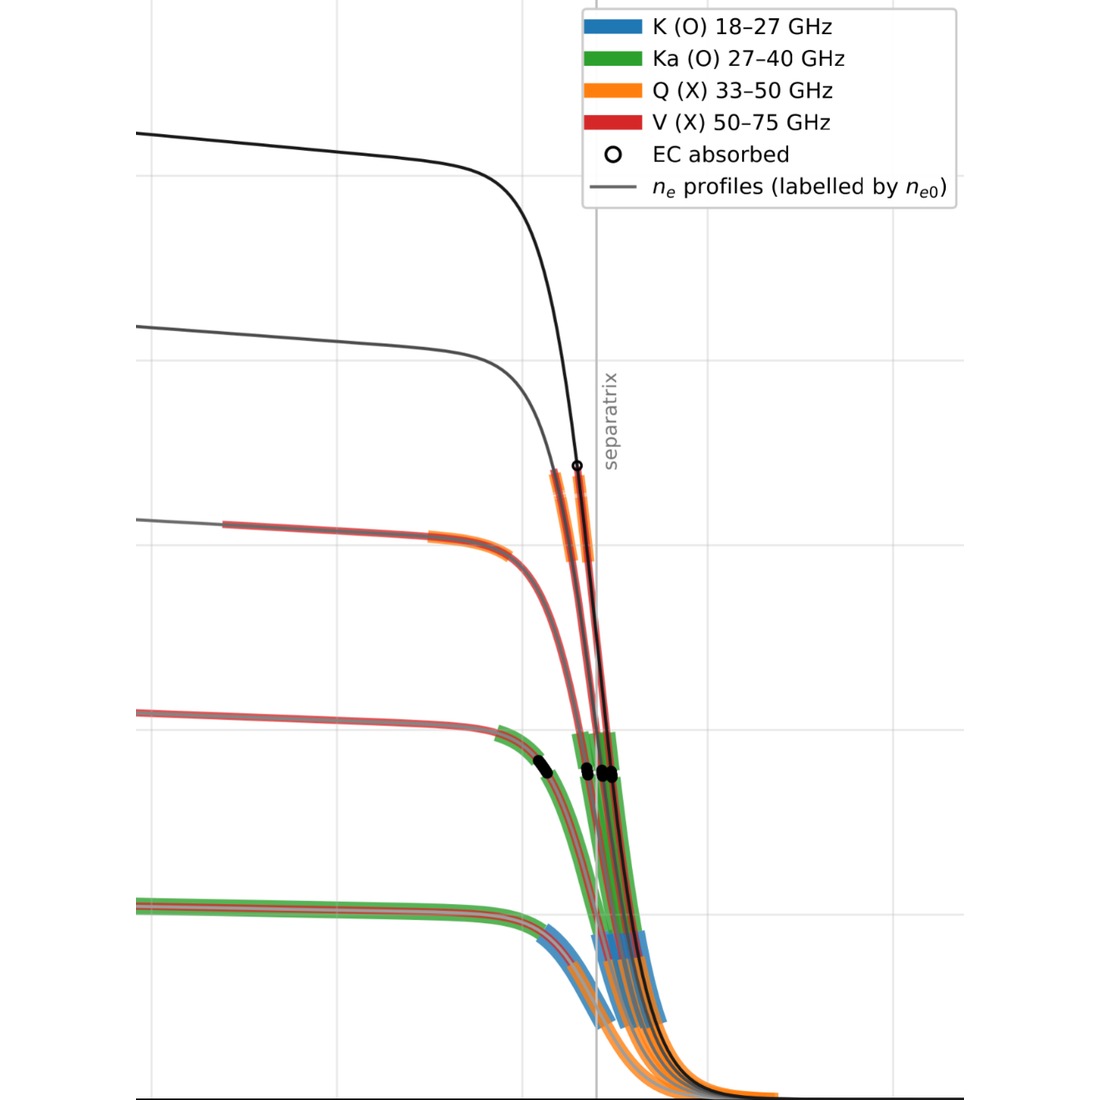
A profile reflectometer sweeps a microwave beam in frequency; each frequency reflects at its cutoff, set by density and magnetic field, and its delay locates it: one sweep, one density profile. Non-perturbative, no in-vessel calibration targets, no large ports, no fragile optics. In dense, high-field next-gen MCF devices and future FPPs the beam is absorbed at the electron cyclotron resonance before the plasma core. We measure the gradient region and reconstruct the rest in real time.
What you get
- Multi-band, dual-polarization probing, bands chosen for your field and density: 18–75 GHz in the prototype, higher for FPPs
- Full-band sweep in ~20 µs in the prototype, with agile sources and IQ detection, robust at low signal-to-noise
- Resolution set by antenna and frequency, ~0.5 cm in the prototype; fast sweeps track ELM crashes and pellets
- Physics-informed reconstruction of the full profile in real time where density and field block the core
- Delivered as a standalone system or as part of our integrated Modular Diagnostics Platform solution
How it works
We derive the frequency plan, polarizations, and antennas from your field and density, and engineer systems for your port geometry, with our synthetic diagnostics and design tools (SynthDia, TRAVIS, others). All bands share one waveguide line and port: fewer penetrations in shielding and blanket. Physics-informed neural networks constrained by transport physics fill the core from the measured gradient, with uncertainties.
Proof
Our team has reflectometry experience from JET, WEST, DIII-D, ASDEX Upgrade, and ITER. We are developing a prototype profile reflectometer and ECE radiometer, to be tested on TCV in early 2027 and on DIII-D in spring 2027, with Versatile Integrated Data Acquisition software and physics-informed neural networks for real-time ne and Te reconstruction. The prototype passed its DIII-D Physics Validation Review in 2026. Confinement-state classification with a profile reflectometer for FPPs is published in Nuclear Fusion with UC San Diego and UCLA.